Top Load Entry
Applied Impact Robotics - Engineering Intern - Summer 2025
Purpose
Last summer, the mission outlined entering the oil tank from an entry point on the side of the oil tank. However, between summer of 2024 and summer of 2025, operational requirements changed, forcing the deployment process to begin from the top of the tank.
The pivot in deployment location is due to complications experienced by other inspection robot startups. As a result, the customer highly advised against attempting to enter from the side. However, entering from the top presents its own set of challenges.
The Challenge
Mechanically, deploying and especially retrieving the robot from the top of the tank is much simpler than from the side. However, in the space between the surface of the oil and the roof of the tank, there exists a vapor layer. The challenge is when the manhole on the roof is opened, there is a supply of oxygen, and combined with a robot with significant electronics and power supply, the recipe for a massive bomb is brewing. My work this summer was dedicated to neutralizing this risk.
Research
Starting out, it became clear there were only a few options. The idea of isolating the oil tank from the rest of the atmosphere was thrown around, which could be accomplished by placing an apparatus similar to a tennis bubble around the manhole prior to opening it, but that would require a human who needs oxygen to breathe, and given the expected time to inspect a tank, that simply wasn’t a viable solution. It’s inevitable that there will be oxygen somewhere inside of the tank, so the focus shifted to preventing fume contact with it.
Vapor Pressure
Quickly, the concept of vapor pressure was mentioned. I’ve taken two chemistry courses ever, once in high school and another in college, and to be frank, it’s not my wheelhouse. As a result, it took a while for me to understand what vapor pressure actually is.
After researching and thinking about it for a while, I realized that vapor pressure is the partial pressure exerted by the vapor of a liquid when net evaporation is equal to zero. Initially, however, I thought that applying an external pressure greater than the vapor pressure of a volatile liquid (a liquid substance that evaporates quicker, like ethanol) would stop evaporation. If this were the case, then a low-density inert gas could pressurize the deployment apparatus, narrowing the vapor layer to just above the surface of the oil, and preventing any contact with the oxygen. This not the case, however.
In a closed inert gas-volatile liquid system, the partial pressure produced by the evaporated liquid will rise until it reaches the vapor pressure of that liquid, increasing the total pressure. For example, if I have inert gas A pressurized to 100 kPA and a volatile liquid with a vapor pressure of 50 kPa, the liquid would evaporate until the partial pressure is equal to 50 kPa, increasing the total pressure to 150 kPa. So, in theory, the idea of pressurizing the system wouldn’t work, but theory is rarely directly applicable to the real world.


Setup
I assumed that the theory was accurate, but I wasn’t so focused on whether or not the volatile liquid would evaporate until it reaches its vapor pressure, but rather how long that would take.
Detecting Gas
At this point, I knew that the total pressure of the system would increase, but still being focused on the idea of keeping the vapor low in the apparatus, away from oxygen, I needed to understand how the concentration of the gas changed with location and time. So I used several different types of MQ sensors. It’s important to note that I didn’t have a method for calibrating the sensors for gas concentration, so I was only able to compare concentrations relatively, not exactly. For these tests, though, it didn’t matter.
There are online resources that disclose which gases the sensors are best for detecting, but I figured I’d test them myself. I built a suite with nine sensors so that I could test their reaction to different volatile liquids. Really, I just took an electronics box and drilled a bunch of holes into it, but it was simple and cheap. I then began placing sharpies and Clorox wipes into it to validate that they did indeed perform differently. I then selected acetone as the liquid of choice for all subsequent testing, and selected the most reactive sensor.

Experimentation
Pressure + Relative Gas Concentration Testing
The next step was to implement this sensor into a pressure testing rig to see how an external pressure affects the concentration gradient and volatile liquid evaporation. The chosen inert gas was helium because it’s lighter than oxygen and acetone.
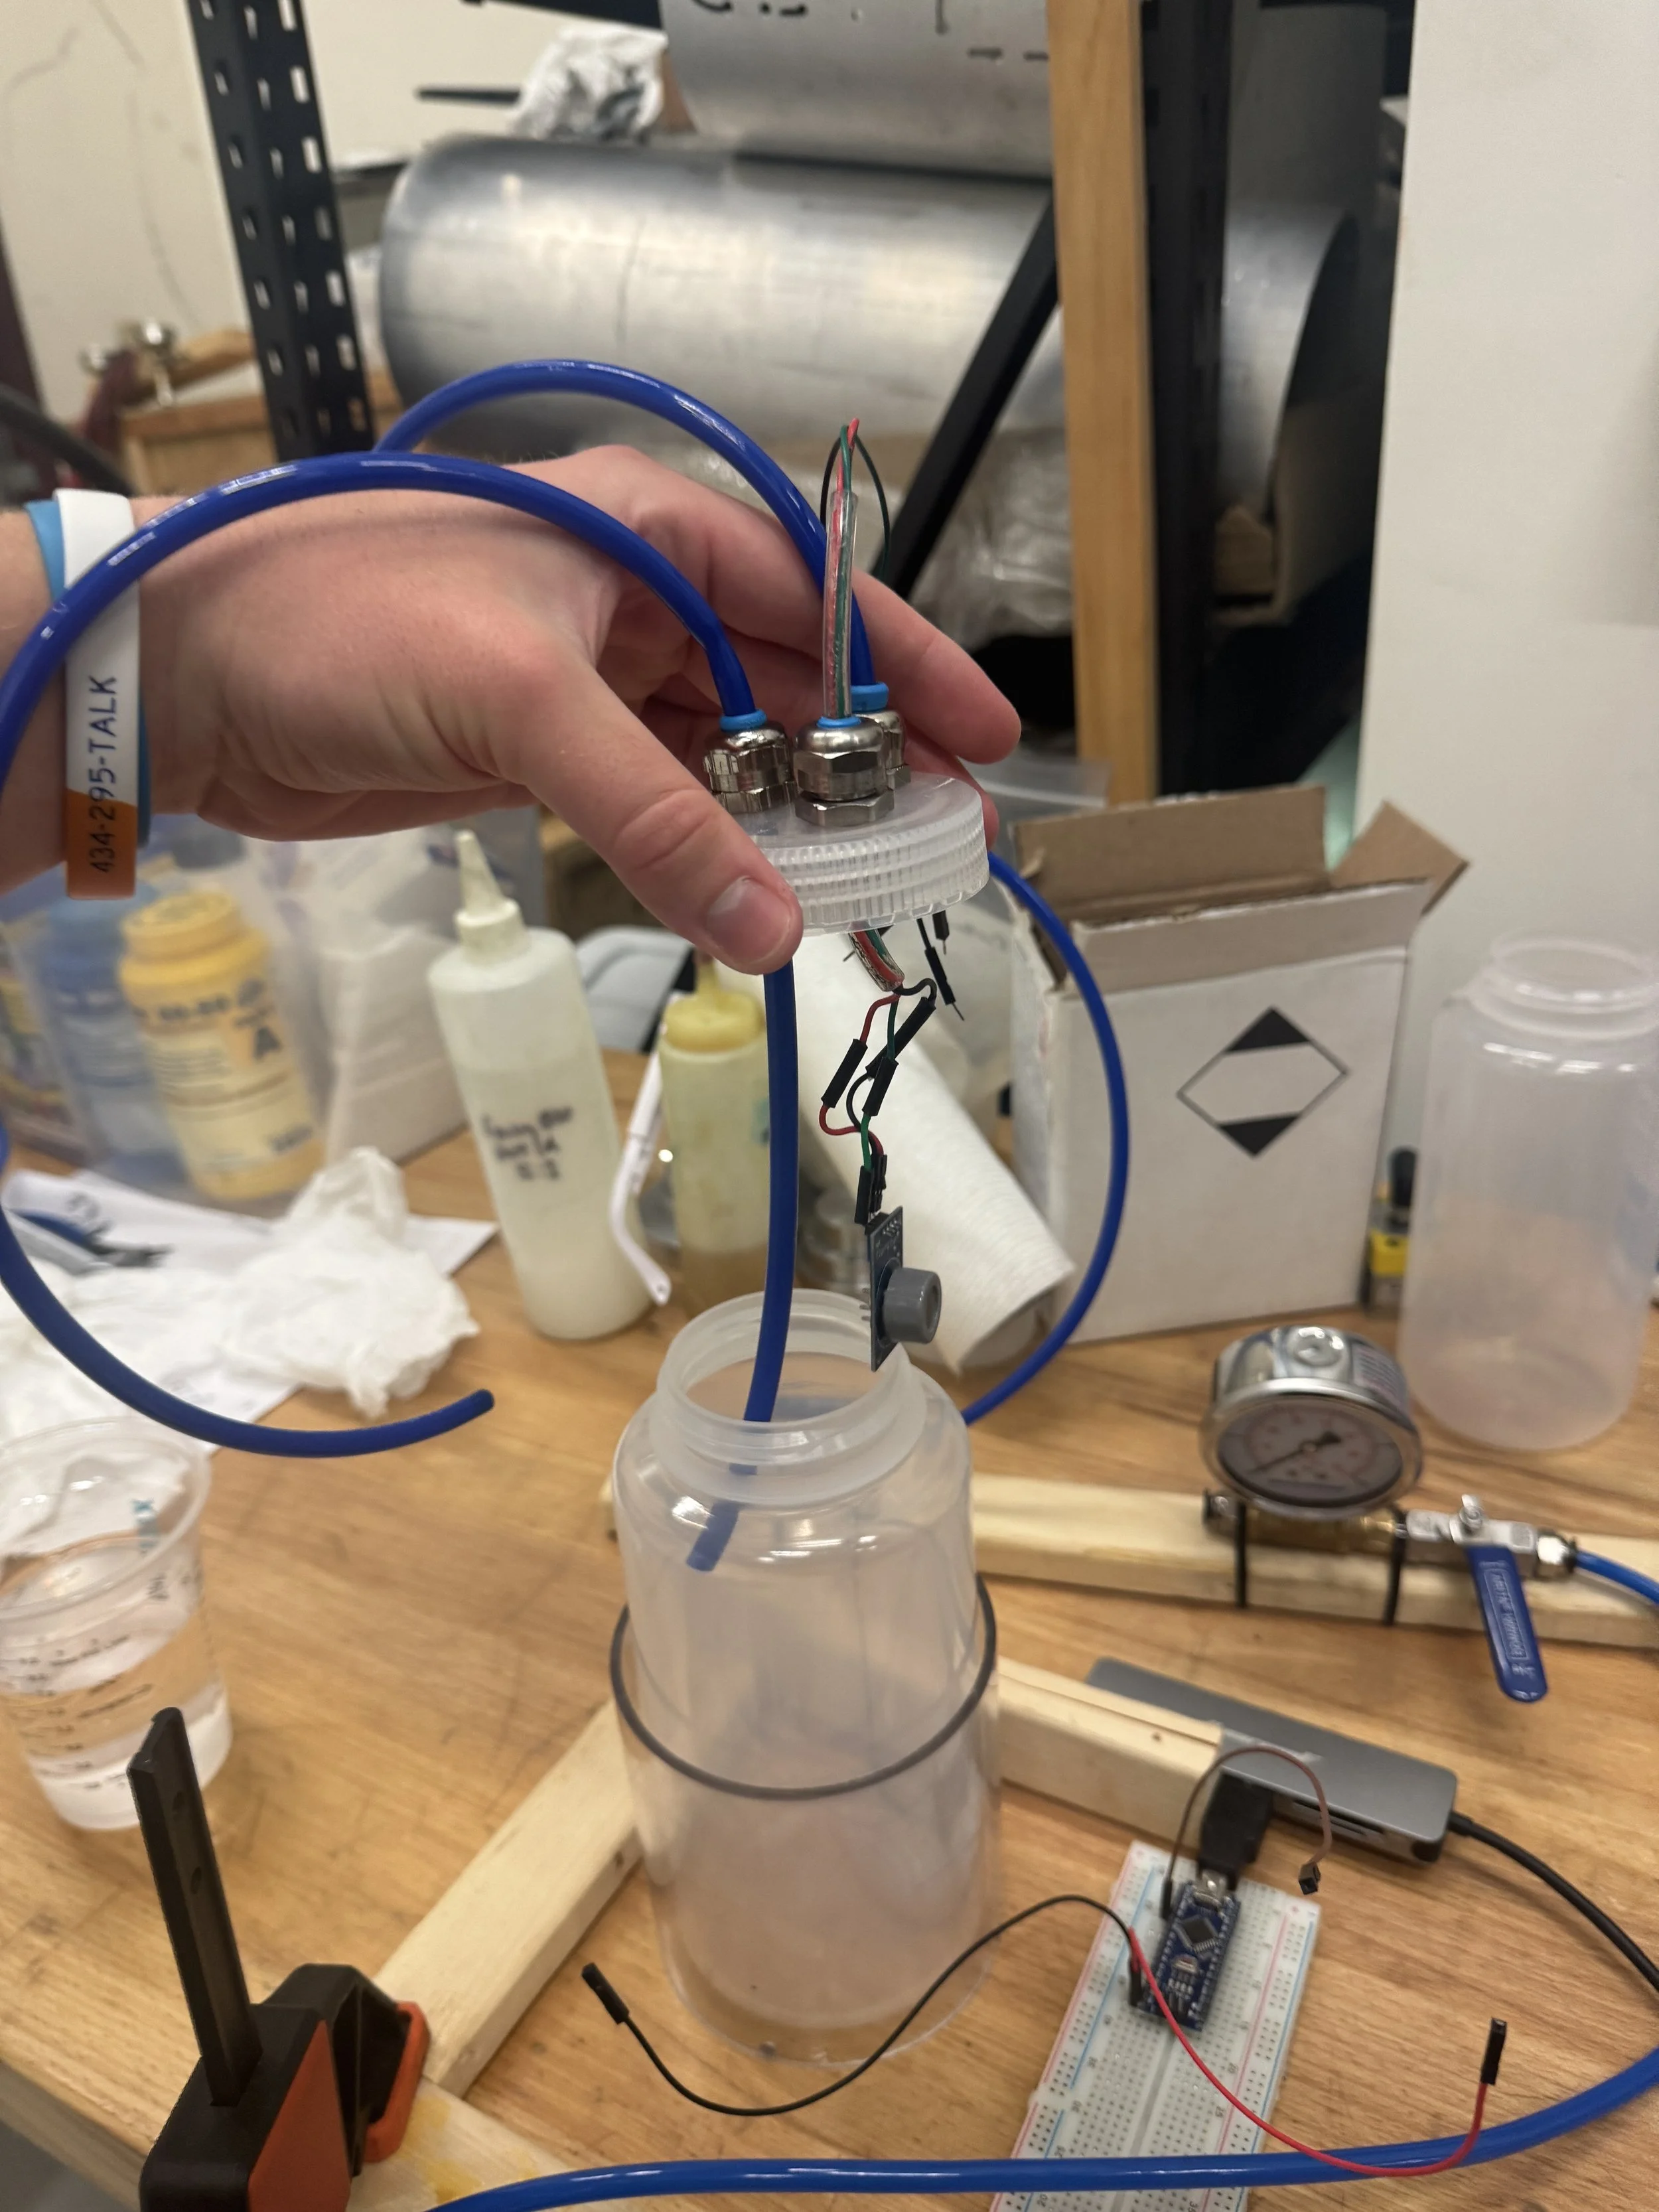
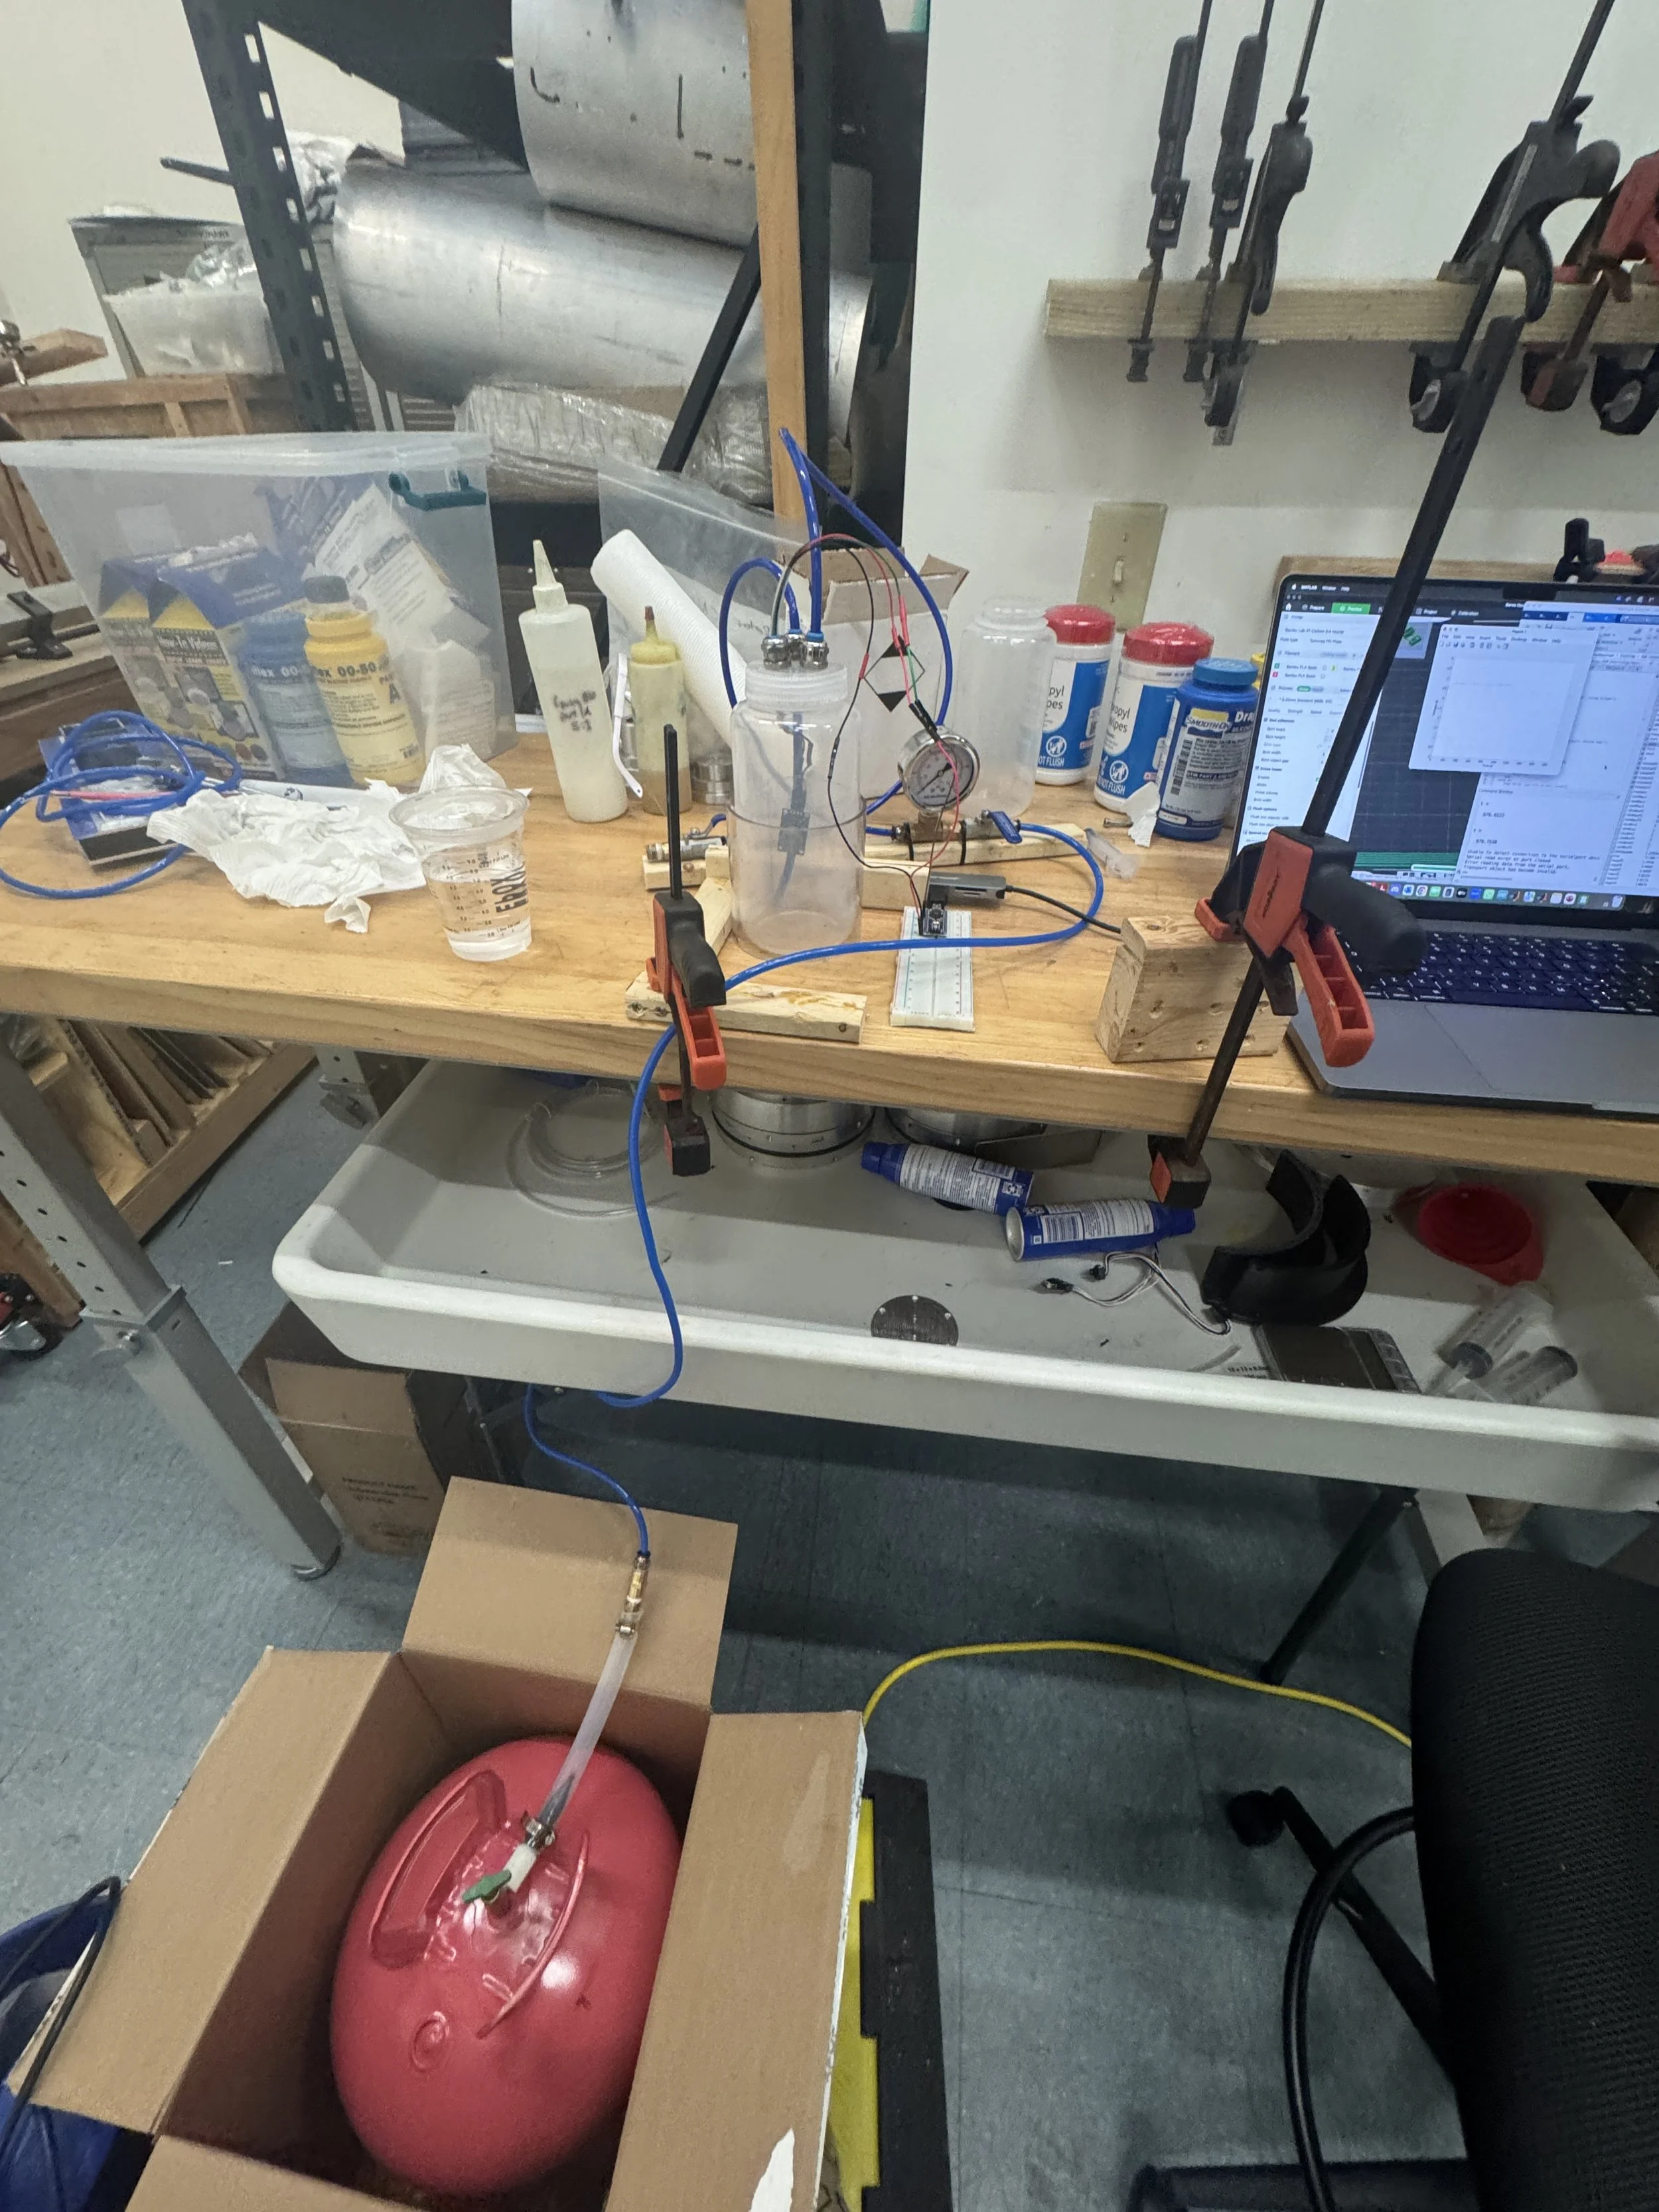
Building an inexpensive, reliable, and rigid rig took some trial an error, but I eventually landed on a small chemical container. This was a white wire solution but I needed to move quickly. I drilled a three holes in the lid for the inlet and outlet, and then for a wire connection between the microcontroller and the sensor inside. Starting at the helium supply (from a party store), the helium would travel through a tube to a valve, then a pressure gauge, and then the container. From the container, gas would exit through the outlet to another valve.
Procedure
Each test began with filling the container with 50 mL of acetone, and then sealing it. The system was then purged with helium for 10 seconds to remove oxygen or any acetone vapor that accumulated after sealing. Then the valve after the outlet was closed, and the container could be charged to a specific pressure. Once the pressure was achieved, the timer for 15 minutes would begin. Voltage data from the sensor was transmitted to the microcontroller and then to MATLAB for live plotting, and pressure data was collected by taking a time lapse of the pressure gauge. Pressure data points were taken every minute. Two or more trials were performed for each pressure.
The testing pressures were 0, 2, 4, and 6 psig. The container could not handle pressures beyond 6 psig.
Analysis
When testing at 6 psig, the sensor died. Thankfully, because the sensor was not calibrated and the lack of capability to place other sensors are varied heights in the container to obtain a relative concentration gradient, the voltage data wasn’t necessary.
Data analysis was performed in MATLAB. Change in pressure vs starting pressure was graphed, and then that curve was extrapolated to predict the pressure increase (due to the partial pressure) over greater starting pressures for 15 minute periods. There were limitations in the analysis, especially the lack of more data points to achieve better lines of best fit. Testing over 15 minutes also didn’t give insight into what happened after.
Result
Analysis showed that with a greater starting pressure, the change in total pressure over 15 minutes diminished, exhibiting hyperbolic decay. The partial pressure of the vapor also never reached its vapor pressure. Still, though, the total pressure rises, and given enough time, a volatile vapor could eventually dilute or mix to where there is oxygen. When presented to company leadership, the data was met with the decision to opt for constant flushing to maintain a higher safety factor. This data directly informed the methodology of a critical aspect to the entire company’s mission, and I’m proud to say that I was responsible for it.